What is Microsoft Power BI?
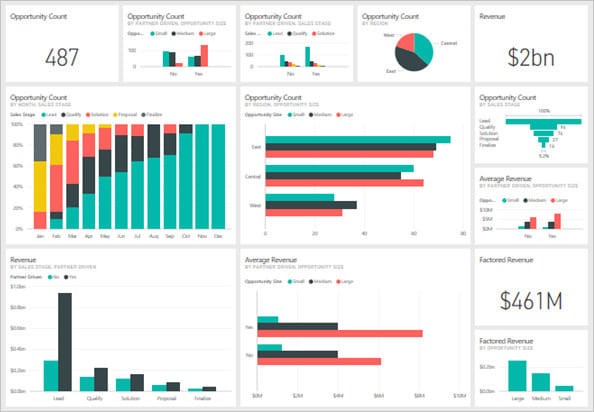
Power BI is a visualization and data modeling tool to get valuable and holistic insights in a company’s business processes. Power BI is currently the most trendy self-service BI-tool on the market. The popularity is mainly because of the easy usability, the broad capabilities and the comparably low cost. The modern desktop application allows the development of custom reports and to share these reports to other users. From Excel to SAP (including HANA), Power BI is able to utilize almost every type of data sources with ability to load the data with adjustable frequency (e.g. once a day in the morning) or also ad-hoc based on user requests. In addition to this, Power BI can handle high volumes of data, where the developers are able to create complex reports for any business demand. After publishing the reports, users are empowered to create personalized or role-based dashboards.

For which business purposes is Power BI used?
Power BI can be used for all kind of reporting and analysis activities. The visualization capabilities have evolved over the last few years so the tool can provide more flexible and user-related experience. To have an understanding about the data and support the analytical thinking, Power BI comes with a variety of graphics and drill-down possibilities. Power BI can visualize all kinds of data if the right KPIs to measure the company’s processes are defined.
Real use case of a hygiene and health company:
- Product sales in regional stores up to the overall performance of the company
- Reveal the bottleneck of the purchase-to-pay process
- Support the complete Supply Chain processes
- Inspect and analyse travel costs for HR
- Measuring workplace health rates
- Follow project performances and project implementation phases
How does Power BI fit into a company’s application architecture?
Power BI can access a wide range of sources like files, databases and online services. Important to know is that the published reports sometimes need a gateway to the on-premise data sources so Power BI can update the data.
Power BI has the inbuilt capability to join and import data from SAP HANA environments and is able to combine datasets from different sources (e.g. excel with manual data to load and used with HANA sources).
In our clients’ world the most common sources are:
- SAP data sources
- Excel files that are stored in SharePoint folders
- MS SQL database, Azure database
The SAP BW connector links the SAP BW directly with Microsoft Power BI. However for performance tuning reasons the preferable option is to connect through the SAP HANA views. In case of ERP reporting that is the only option is to go through HANA views.
How can a company use SAP HANA data for Power BI reporting?
SAP BW objects can be generated in HANA as attribute views, analytical views or calculation views dependent on the objects. These views can be part of the other views which creates the source of a PBI report. In this case, either a cube can be converted to HANA to be a source of data or any InfoProvider which can be included in calculation views for reporting purposes. It is possible to work with a partial dataset with generating only the necessary objects to HANA and also with further field restrictions.
There is also an increasing demand for reporting of ERP data. The HANA Sidecar solution replicates the ERP data to HANA. It can be used in the same way for creating calculation views and to be a source of a PBI reports.
Based on ERP or BW sources, the calculation views are rather for agile reporting since the most relevant data are available. By combining the sources, we can generate more tactical exploratory analytics.
How to manage data access?
There are several security layers of a report – this guarantees to get the right access to the data. We can distinguish between reports and data access. Report access is the role-based access where people or a certain group of people are defined for the required access to the report itself, but without a restriction of the data. However, data access is the permission for users to access the underlying data. But what happens if users in different regions can see data only of their regions?
Row level security gives the possibility to utilize the security restrictions defined in the data source, so people will see only the right set of data in the report that they have access to.
When do companies need the support of PowerBI experts?
Power BI is a user-friendly tool and users can quickly build up a simple report with an attractive view basically without any consultancy. Support and experts’ knowledge come into picture when more complex reports are needed, challenging presentation layer and/or requirements of a difficult data model.
Data Modeling is one of the features used to connect multiple data sources using a direct relationship. With data modeling knowledge we can help to define how the data sources should relate to each other and create interesting data visualizations on multiple data sources.
With the modeling feature, we can build custom calculations on the existing tables, add new tables for the data representations, aggregate or define new metrics. Depending on the tasks, it may require SQL knowledge and experience.
One of the most common support tasks is to structure and clean redundant data and create the right data structure for the reporting. Other areas are: data connection, report adjustments, data model verification, setting up automatic data refresh, access issues, workspace upgrade, license requests, etc.
We provide support activities on different levels:
- Service Desk for routine and administrative tasks
- L2 support for recurring incidents, requests
- L3 support for tasks that require expert knowledge/experience or urgent action

